Explaining math visually
Learning how to create engaging math animations using manim.

Math is hard. For most, it is also boring. One of the major reason behind it is that not everyone can visualize the concepts well. It is also hard for teachers and presenters to explain math concepts without using any visual elements.
Usually, I am stuck to the capabilities of the presentation tool that I am using (Powerpoint or Keynote). They both allow creating basic drawings and animations. My hand drawing is not so good. But if the presentation or lecture is in a small room, I would use the board a lot. Mainly because creating drawing on these softwares is harder and more time-consuming than doing things on board.
Animations do much better job at explaining things visually. But it requires even more efforts. I learned css and javascript in my college days and I do recollect the pain of using them. I was looking for something more simple.
Luckily, I found manim (short for math animation engine). It is a python library for creating animated math videos and presentations. This is created by Grant Sanderson, the creator of 3Blue1Brown YouTube channel. In 2020, a group of developers forked it into the community edition, which is well maintained and tested.
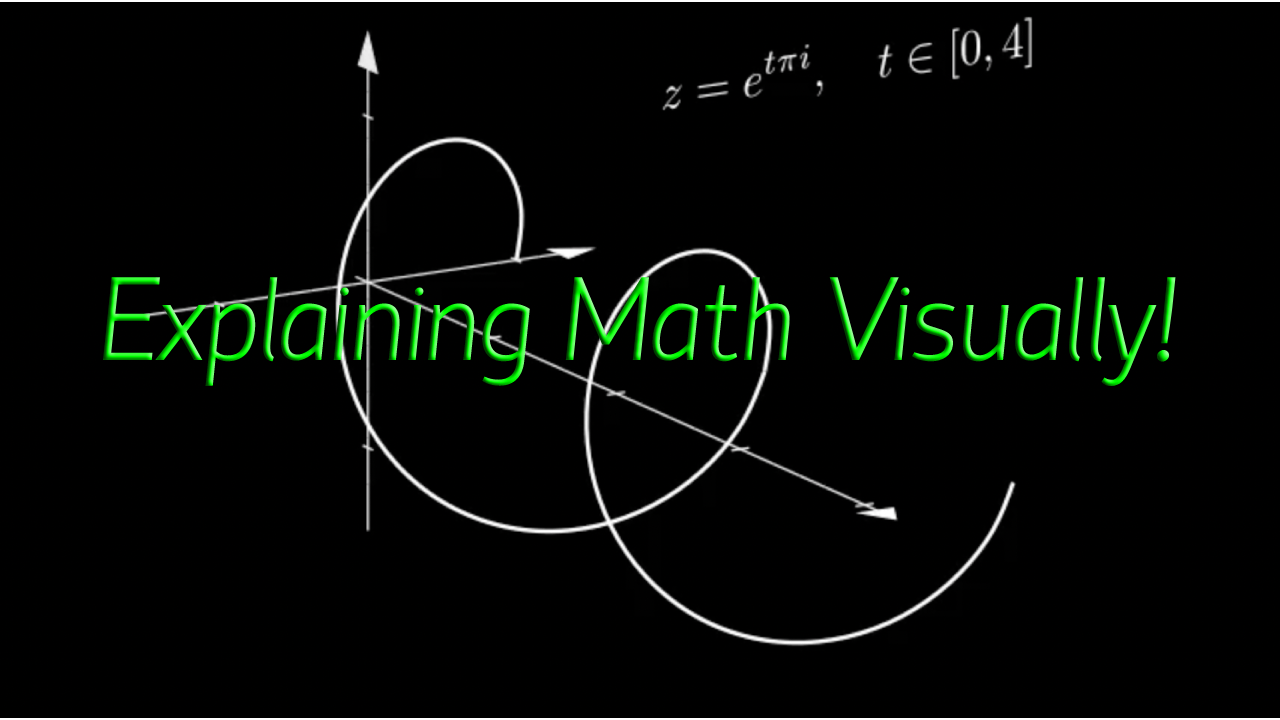
I use python for my projects anyway. I do most of the math related work in python. So, I don’t have to learn a new language for this. I decided to give it a try. Here is what I could produce after a couple of hours of tutorials from skillshare.

I could create this with less than 50 lines of python code. Most of that code is about the function and graph definition. The library does the heavy lifting of creating the animations.
Another good thing about it is that there are more variations of this library. I found one for physics and also for machine learning so far. There is a variant that supports creating slides (where you can go back and forward with animations with arrow keys). This can be useful for creating short presentations for conference talks.
Moving forward, I want to learn this in more details and use it in my presentations. It might take a while to create the presentations. But I believe the effort is worth it. It anyways requires less effort than other animation tools.
Here are the milestones for the next year:
- Install the library. (Checked)
- Create a small animation video. (Checked)
- Start generating image visualizations and include them in regular presentations.
- Add small ‘gif’s generated with manim in the regular presentations.
- Create one 5 minute presentation with manim.
- Create one 20 minute presentation with manim.
- Create one 60 minute presentation with manim.
The last one seems like a stretch. But I plan to create my PhD thesis defense (should be somewhere in 2024) using manim.
Resources:
The code used for generating the animation above.
My favorites
Video: Productivity Myths (Ali)
Quote: “'Someday' is a disease that will take your dreams to the grave with you.” ― Timothy Ferriss, The 4-Hour Workweek